Website Uptime Monitor & Dashboard
Track the uptime of any website or URL directly from Odoo. Get notified the moment a site goes down — and again when it recovers. Visualise everything in a fully customisable live dashboard.
Odoo 18 & 19 | Free | No external services required
Available on the Odoo Apps Store.
What It Does
Website Monitor runs scheduled HTTP checks against unlimited sites and URLs, records response times and status codes, and alerts the right people when something transitions from up to down — or back up again. Everything lives in Odoo: configuration, history, notifications, and a drag-and-drop dashboard for a real-time overview of all monitored sites.
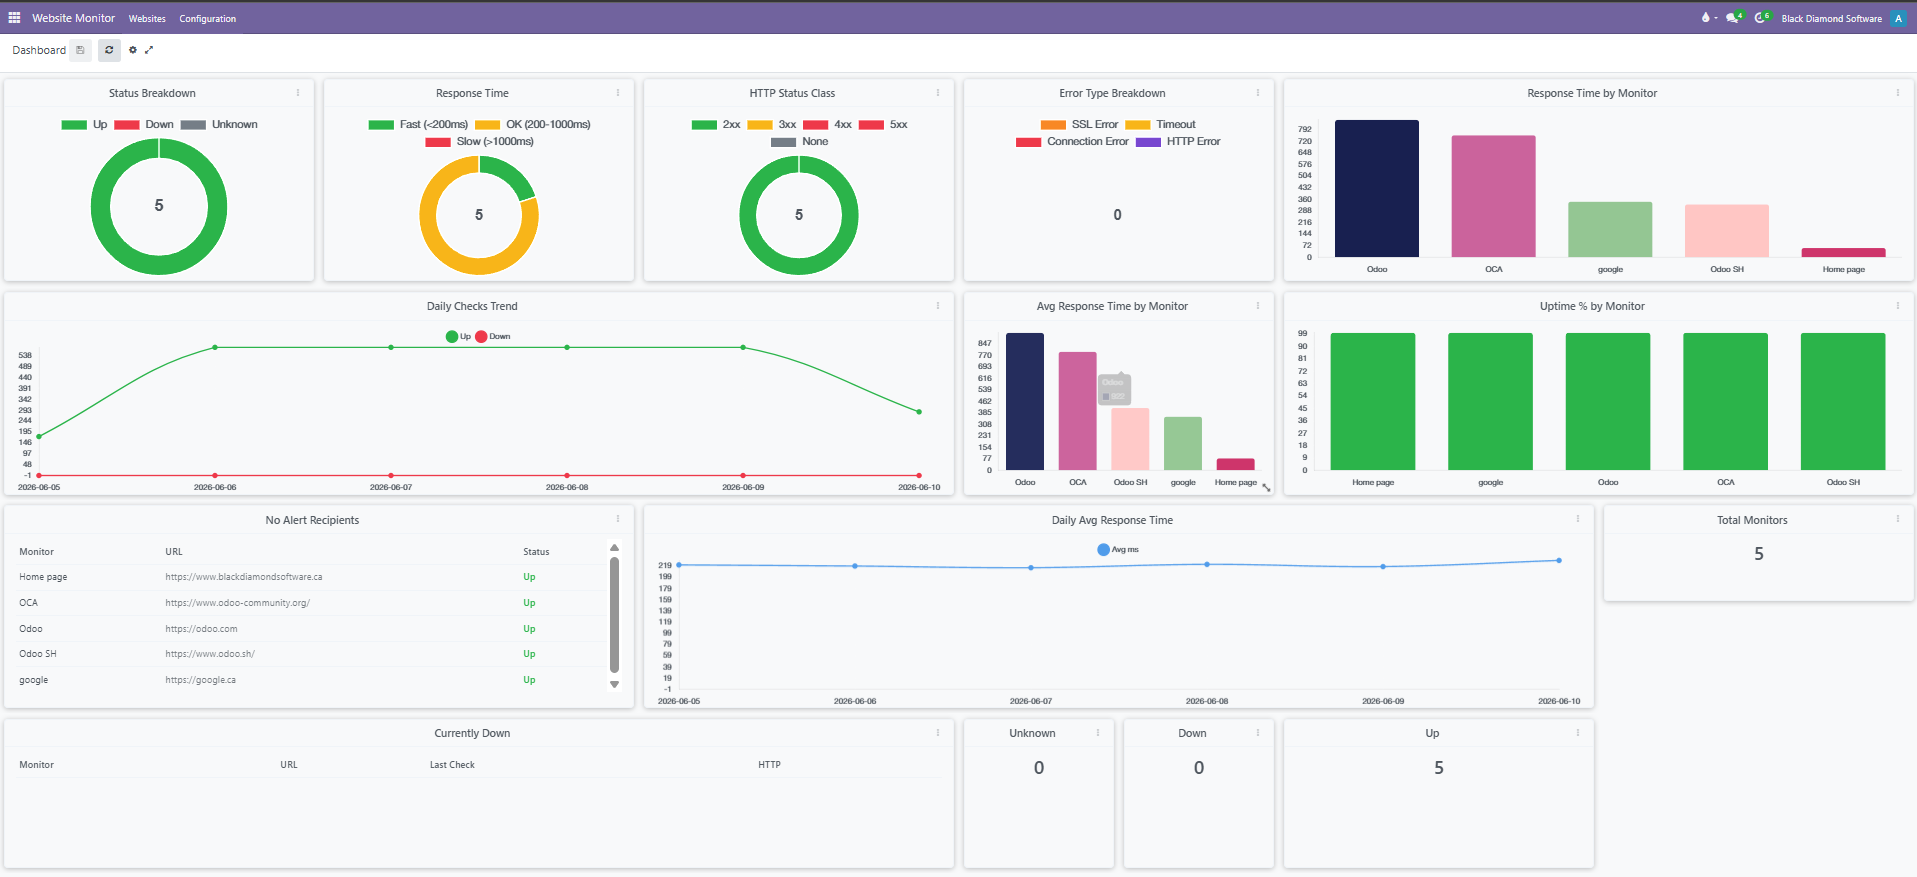
Live Dashboard
A fully interactive drag-and-drop dashboard gives you a real-time overview of all your monitored sites. Add, remove, and rearrange widgets to match your workflow. Save your layout per user and go fullscreen for a NOC-style display.
- Number cards — at-a-glance counts for Total Monitors, Up, Down, and Unknown, with configurable thresholds that highlight when a number goes critical
- Pie charts — Status Breakdown, Response Time buckets, HTTP Status Class, and Error Type Breakdown, all with clickable drilldowns into the underlying records
- Bar charts — Current Response Time, Downtime Incidents, Average Response Time, Uptime %, and Monitors by Tag — per monitor, with drilldown
- Line charts — Daily Checks Trend (Up vs Down over time) and Daily Average Response Time trend to spot degradation before it becomes an outage
- List widgets — Recent Incidents, Currently Down, and Monitors with No Alert Recipients, all linking directly to the relevant Odoo records
- Drag-and-drop layout — rearrange and resize any widget freely; save your layout per user and reset it any time
- Time range and thresholds — per-widget configurable time range for historical charts, and alert thresholds on number cards that turn red when exceeded
- Fullscreen mode — one click to expand the dashboard to fill the screen, ideal for a wall-mounted monitoring display or NOC screen
Monitoring & Alerting
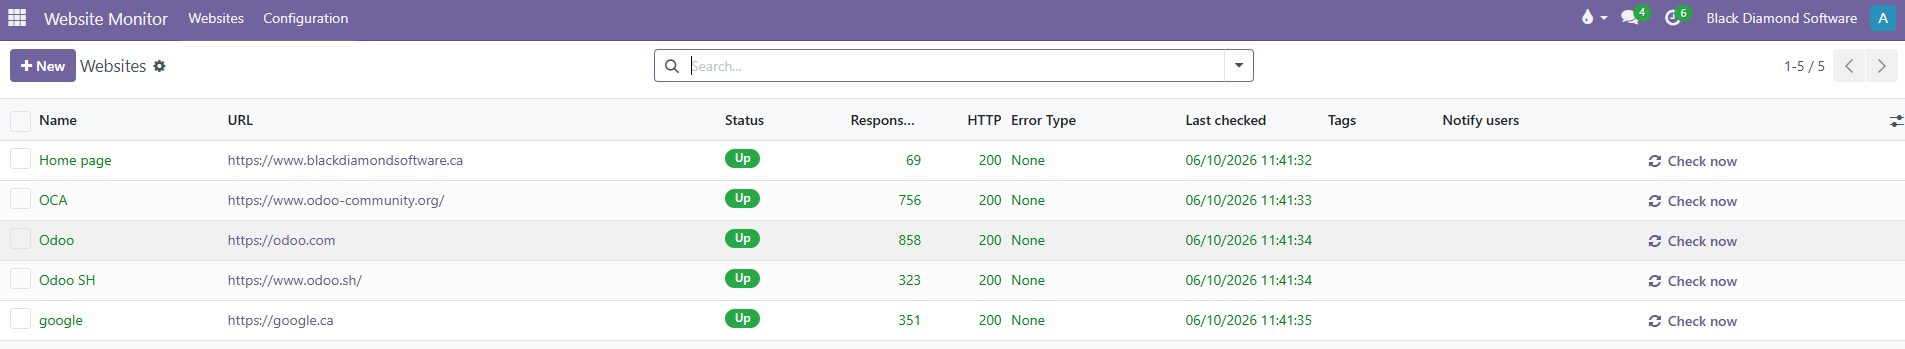
- Monitor any URL — add unlimited websites or endpoints; each monitor tracks HTTP status codes and response times on every check
- Smart alerts — notifications fire on status transitions only (up→down and down→up), so your inbox stays quiet until something actually changes
- Per-site recipients — choose exactly which Odoo users receive alerts for each monitored site; different teams can own different monitors
- Flexible check interval — set the polling interval from 1 minute to 1 hour via Settings → Website Monitor; no code changes required
- Inbox and email — deliver notifications via Odoo Inbox, Email, or both, configured globally from Settings
- Full check history — every check logged with timestamp, HTTP status code, and response time; history auto-cleaned after a configurable retention window
- Tags — organise and filter monitors by environment, team, or priority; the Monitors by Tag dashboard widget shows counts per tag with full drilldown
- Per-site colour — assign a colour to each monitor so it's instantly identifiable across all dashboard charts and graphs
- Manual "Check now" — run an immediate check on any record without waiting for the next scheduled interval
How It Works
- Install the module and open the Website Monitor app.
- Add a monitor: give it a name, enter the URL, and pick notification recipients on the Notifications tab.
- Hit Check Now for an immediate result, or let the scheduled cron poll automatically at your chosen interval.
- Receive an Odoo inbox message and/or email the moment a site's status changes.
- Open the Dashboard for a live overview — add and arrange widgets to suit your team.
- Review the full check history at any time from the monitor's Logs tab.
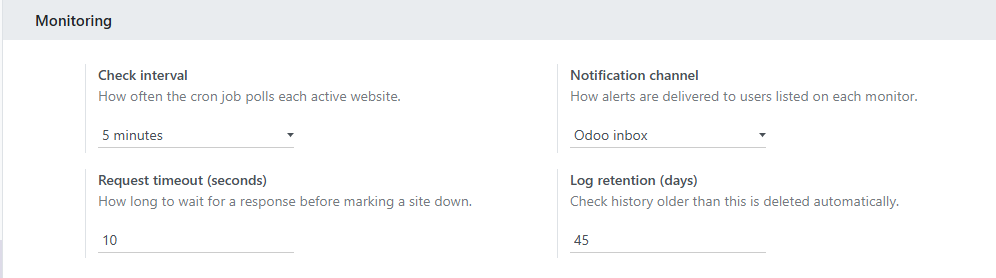
Configuration
All global settings live under Settings → Website Monitor:
| Setting | Default | Description |
|---|---|---|
| Check Interval | 5 minutes | How often the cron polls each active site |
| Notification Channel | Inbox | Inbox, Email, or Both |
| Request Timeout | 10 seconds | How long to wait before marking a site as down |
| Log Retention | 30 days | Check history older than this is purged automatically |
Access Rights
- User (read-only) — can view monitors, current status, check history, and the dashboard; cannot create, edit, or trigger manual checks
- Manager — full access to create, edit, and delete monitors, manage per-site alert recipients, and run Check Now; includes User permissions
Global configuration is restricted to Odoo Administrators.
Requirements
- Odoo 18.0 or 19.0
- Standard
baseandmailmodules (included with every Odoo installation) - Python
requestslibrary (bundled with Odoo — no extra installation needed) - No external services required — all checks run server-side within your Odoo instance
Screenshots
The Problem It Solves
Without built-in monitoring, teams rely on external SaaS tools that don't integrate with Odoo's user model, notification system, or access controls. Alerts go to a shared inbox, on-call rotations live in a spreadsheet, and nobody on the ops team can see site health without switching contexts.
This module keeps monitoring where your team already works — with per-site routing, native Odoo notifications, and a dashboard that shows what's up and what's down at a glance.
Built For
Businesses and MSPs running Odoo who need reliable website and URL uptime monitoring without adding another standalone tool to their stack.